
Insights
Trading pulse, strategy breakdowns, and execution health analytics.
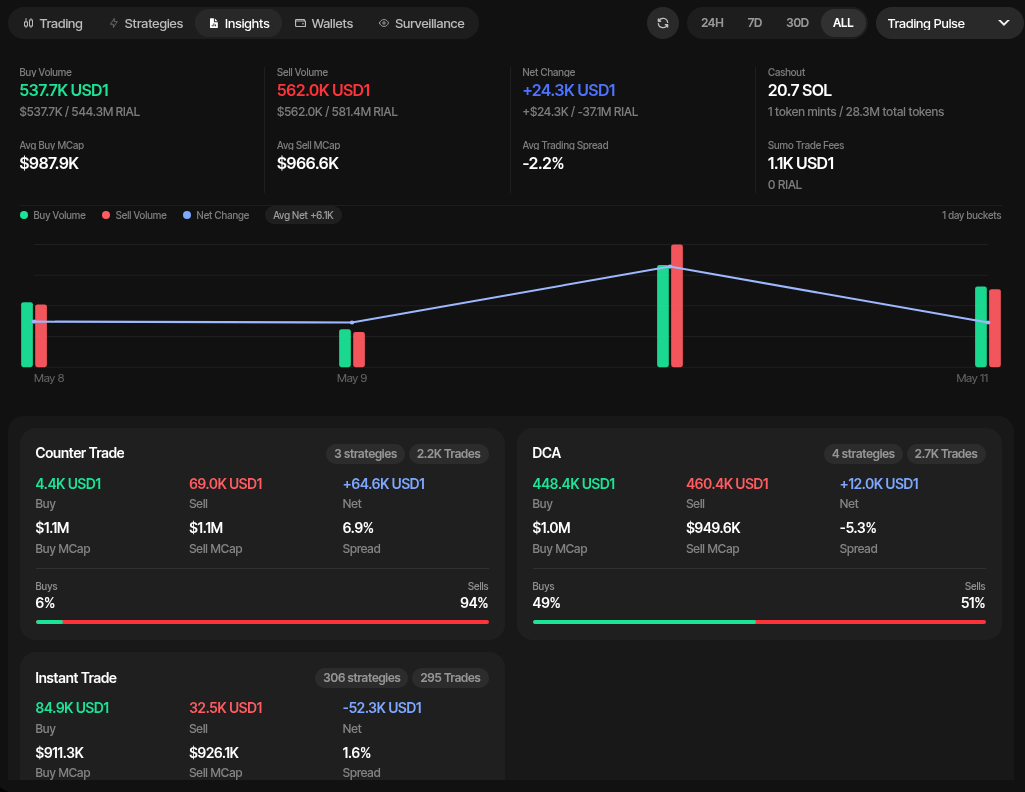
The Insights tab gives you a performance view for the active profile. Use it to understand buy/sell flow, net position change, strategy contribution, withdrawals, Sumo trading fees, and execution quality without leaving the live trading workspace.
Access it from the profile workspace by opening Live Trading and selecting Insights below the chart.
Time Range
Filter all metrics by time range using the buttons in the top right:
- 24H — Last 24 hours
- 7D — Last 7 days
- 30D — Last 30 days
- ALL — All time
Use the section selector beside the range controls to switch between Trading Pulse, Strategy Breakdown, and Execution Health.
Trading Pulse
Trading Pulse summarizes profile-level trading activity for the selected period:
| Metric | Description |
|---|---|
| Buy Volume | Total buy volume in quote asset, USD, and tokens |
| Sell Volume | Total sell volume in quote asset, USD, and tokens |
| Net Change | Net position change (buys minus sells) |
| Withdraw | Total withdrawn in native asset and token mints |
| Avg Buy MCap | Average market cap at which buys were executed |
| Avg Sell MCap | Average market cap at which sells were executed |
| Avg Trading Spread | Percentage spread between average buy and sell prices |
| Sumo Trade Fees | 1% platform fees attributed to Sumo-executed trading volume |
The chart visualizes buy volume, sell volume, and net change over time with interactive hover tooltips.
Strategy Breakdown
Strategy Breakdown groups performance by strategy type, such as Counter Trade, DCA, Limit Order, and Instant Trade. Each card shows buy volume, sell volume, net change, average buy/sell market cap, spread, trade counts, and the buy/sell split.
Execution Health
Execution Health monitors order reliability and latency:
| Metric | Description |
|---|---|
| Total Orders | Number of orders submitted |
| Confirmed | Successfully landed on-chain |
| Failed | Orders that failed |
| Success Rate | Percentage of confirmed orders |
| Submit-Landed P50/P95 | Latency from submit to on-chain confirmation (median and 95th percentile) |
| Create-Landed P50/P95 | Latency from order creation to confirmation |
| Retry Rate | Percentage of orders that required retries |
| Avg Attempts | Average retry count per order |
A failure breakdown shows the most common failure reasons so you can quickly separate market conditions from configuration or execution issues.