
Live Trading
Monitor trades in real-time as they happen on-chain.
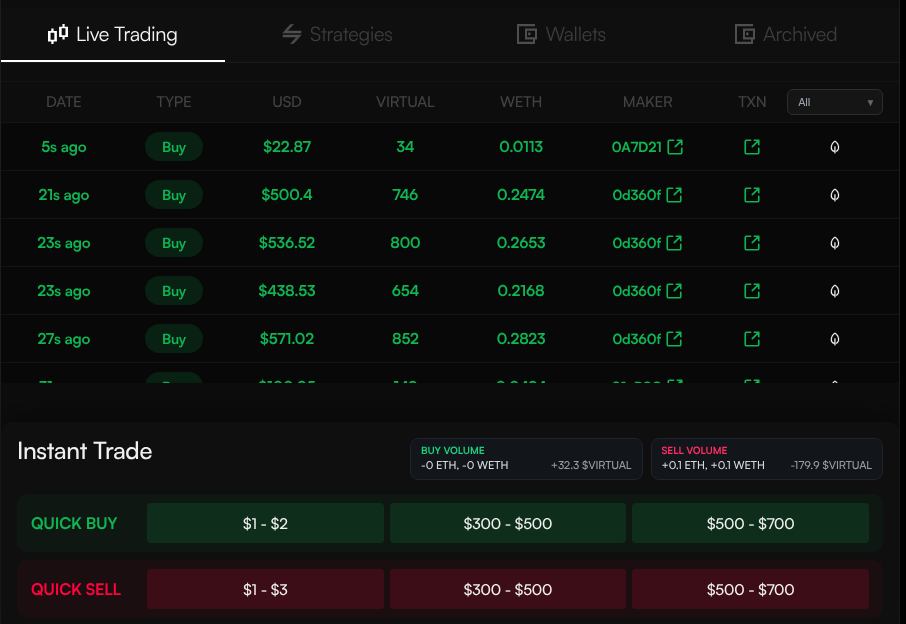
The Live Trading page is the main operating workspace for an active profile. It combines the live chart, streamed pool trades, strategy and wallet tabs, Insights views, and manual trade controls in one screen.
Chart
The chart shows live price or market-cap movement for the profile's pool. Use the interval controls to switch candle size, toggle volume and Sumo trade markers, and switch between market-cap and price display. The drawing toolbar supports annotations such as trend lines, rays, paths, circles, and freehand marks.
The header above the chart shows current market and treasury metrics, including market cap, token supply held by profile wallets, native treasury balance, and quote treasury balance.
Drawing Tools
Use the drawing toolbar to mark up the chart while monitoring live flow:
| Icon | Action | Use |
|---|---|---|
 | Select | Select, move, style, or delete existing drawings |
 | Trend Line | Mark support, resistance, or trend between two points |
 | Ray | Project a line forward from an anchored point |
 | Extended Line | Extend a trend line in both directions |
 | Horizontal Ray | Mark a price or market-cap level from a point forward |
 | Horizontal Line | Mark a persistent price or market-cap level |
 | Fib Retracement | Draw Fibonacci retracement levels between a swing start and end point |
 | Vertical Line | Mark a point in time across the full chart height |
 | Cross Line | Mark a time and level crosshair at a single point |
 | Path | Sketch multi-point moves or scenarios |
 | Brush | Add freehand annotations |
 | Highlighter | Add broader freehand emphasis |
 | Circle | Highlight a specific chart area |
Drawings are saved in your browser for the current profile, chart interval, and price/market-cap mode. Refreshing the page or returning to the same chart restores them. Changing the chart context, such as switching interval or price/market-cap mode, uses a separate drawing set so annotations do not carry onto a different chart view.
The toolbar also supports:
- Undo / Redo — Use the toolbar buttons,
Cmd/Ctrl+Z,Cmd/Ctrl+Shift+Z, orCmd/Ctrl+Y - Escape — Finish or deselect the active drawing tool
- Delete / Backspace — Delete the selected drawing
- Right click or click outside the chart — Finish or deselect the active drawing tool
- Clear drawings — Remove all drawings from the current chart view
Chart Footer Integrations
The footer strip under the chart links out to holder-analysis views without leaving the workspace:
- Bubblemaps — Opens the token's holder map. See Bubblemaps Analysis.
- InsightX — Opens the token in InsightX Atlas Live, an embedded holder and cluster analysis view. Available on Solana, Ethereum, BNB Chain, Base, Robinhood Chain, and Tron.
- Holders — Opens Sumo's holder analysis for the token.
- TA — Opens the technical analysis view.
Project Notes
Use Project notes to pin operating notes to the chart while you monitor price action. Notes can be tied to the current chart context, such as interval and price/market-cap mode, so a team can record why a level, event, or market condition mattered at the time.
Project notes are useful for:
- Marking support, resistance, or intervention levels
- Recording launch, migration, or liquidity events
- Leaving handoff notes for another trader or market maker
- Keeping founder-facing commentary beside the trading view
Team notes appear with the profile's other live-trading context, so operators can review market decisions without searching through chat history.
Workspace Tabs
The tabs below the chart keep the profile workflow in one place:
- Trading — Live trade feed and manual trade controls
- Strategies — Counter Trade, DCA, Limit Order, Grid, and other profile strategies
- Insights — Trading pulse, strategy breakdown, and execution health
- Wallets — Profile wallet balances and treasury actions
- Surveillance — Wallet tracking and activity monitoring
Trade Feed
The trade feed streams recent and live swaps on your token's pool. New rows continue arriving while filters are active, so chart updates and side-panel metrics keep moving even when the table is focused on a smaller subset.
| Column | Description |
|---|---|
| Date | Relative timestamp (e.g. "11s ago", "3m ago") |
| Type | Buy (green) or Sell (red) badge |
| USD | Dollar value of the trade |
| Quote | Amount of quote asset traded |
| Token | Amount of your token traded |
| Maker | Trader wallet. Click the filter icon beside it to load trades from that maker. |
| TXN | Link to the transaction on the block explorer |
| Tags | Signals and attribution icons for the trade |
| Source | Whether the trade is Organic or Sumo |
Trade Filters
Use the filter menu to narrow the table:
- All — Every trade on the pool
- Organic — Trades from external market participants
- Sumo — Trades executed by your strategies
- Signals — MEV, arbitrage, new holders, full exits, strategy types, holder size, and known trading platforms
The signal filter supports OR and AND matching, so you can either broaden the view or require multiple conditions at once.
Tags
Tags give each trade extra context at a glance.
| Icon | Tag | Meaning |
|---|---|---|
 | Arbitrage | The trade appears to be part of an arbitrage path. If the contract is unknown, the icon links to the contract address. |
 | MEV Actor | The trade is classified as the acting side of a sandwich-style MEV pattern. |
 | MEV Victim | The trade is classified as the affected trade inside a sandwich-style MEV pattern. |
 | New Holder | The maker had no token balance before the buy and holds tokens after it. |
 | Full Exit | The maker sold down to a zero or negligible token balance. |
 | Counter Trade | Trade executed by a Counter Trade strategy. |
 | DCA | Trade executed by a DCA strategy. |
 | Limit Order | Trade executed by a Limit Order strategy. |
 | Instant Trade | Manual buy or sell executed from Sumo. |
 | Whale | Maker balance is at least 1% of supply. |
 | Dolphin | Maker balance is at least 0.1% of supply. |
 | Fish | Maker balance is at least 0.01% of supply. |
 | Shrimp | Maker holds a smaller tracked balance. |
 | Trading platform | Known router, aggregator, DEX, or bot source. Examples include Jupiter, Raydium, Pump.fun, GMGN, Photon, OKX, 1inch, Uniswap, and others. |
The Source column is separate from Tags:
| Icon | Source | Meaning |
|---|---|---|
 | Organic | External market trade not attributed to Sumo. |
 | Sumo | Trade attributed to a Sumo wallet or Sumo strategy. |
Side Panel
The right panel keeps the live operating numbers visible while you watch the chart and feed.
Volume
The Volume card can be switched between 5m, 1h, 6h, and 24h windows. It shows:
| Metric | Description |
|---|---|
| Txns | Total buys and sells, with a green/red split bar for buy vs. sell count |
| Volume | Total traded USD volume, with buy volume and sell volume split out |
| Traders | Unique trader activity, with maker and taker counts shown side by side |
Trading Stats
The Trading Stats card summarizes Sumo-attributed trading performance:
| Metric | Description |
|---|---|
| Total Bought | Total quote value bought by Sumo trades, with USD value when pricing is available |
| Total Sold | Total quote value sold by Sumo trades, with USD value when pricing is available |
| PnL | Net Sumo trading PnL in quote terms and USD terms. Click the row to open the shareable PnL card. |
Manual Trading
Below the metrics, the panel contains manual execution controls:
- Quick Buy / Quick Sell presets for fast manual intervention
- Custom Trade for exact one-off buy or sell orders
- Swap button for the full trade modal, including Treasury Swap
When a profile trades against a stablecoin or custom quote token and its active wallets hold the native asset but none of the quote, a notice appears above Quick Buy: buys spend the quote, so nothing can execute yet. Its Convert button switches the Custom Trade panel to Convert mode with the native-to-quote pair already selected. The notice clears on its own once any quote balance arrives, and the × hides it until the page is next loaded. AutoFix offers the same conversion as a per-wallet fix for buy wallets assigned to active strategies.
Instant Trade
See Instant Trade for details on quick presets, custom trades, and treasury swaps.